Camel TUI
Available as of Camel 4.21
| Development only Camel TUI is a tool for development. It is not for monitoring integrations in production. It has no security and no user permissions: the developer who runs it, or an AI agent connected to it, has full control over the local Camel integrations — running and stopping them, changing their source, sending messages to them and running commands. |
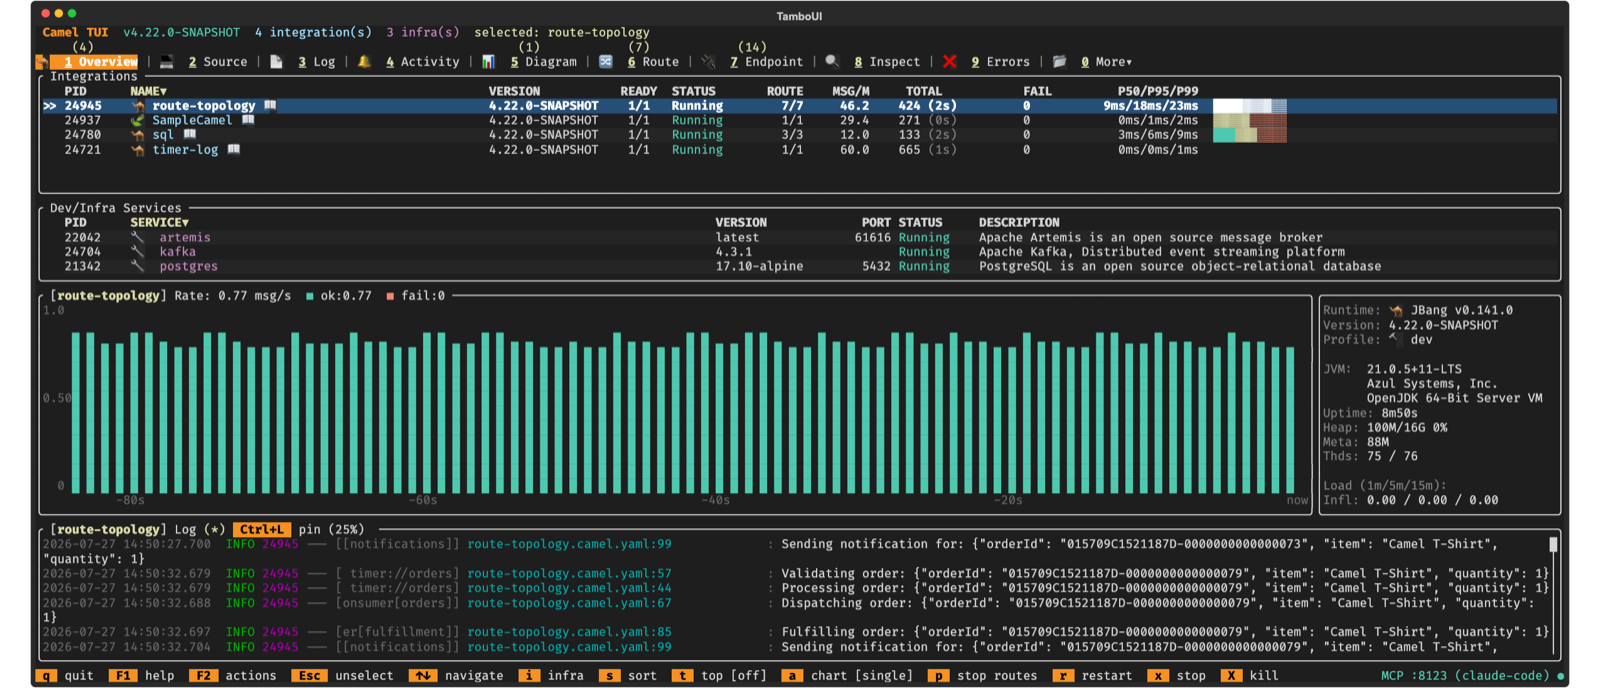
Camel TUI is a terminal dashboard for developing, prototyping, and understanding Camel integrations. With over 40 screens organized across tabs, it makes your entire integration visible — you can browse your project source code with inline documentation, see your route topology, watch messages flow through processors, step through exchanges like scrubbing through a video timeline, inspect Kafka topics, run SQL queries against your DataSources, audit CVE vulnerabilities, and understand what Camel actually does with your routes. No more black box.
Key Features
-
Run anything — your own routes, the built-in examples, or an existing Spring Boot or Quarkus project (Getting started).
-
Write routes with help — a source editor that checks YAML, Java and XML routes as you type, completes endpoint options, fixes problems and shows the live run data of each line.
-
See the integration — the diagram from the architecture down to one route, with live message counts.
-
Watch and troubleshoot — live activity, message history, errors, traces, and deep dives into Kafka, SQL, memory leaks, JFR and CVEs.
-
Ask the AI — the AI panel (F8) with a hosted or a local model, and AI coding agents that see and drive the TUI over MCP and ACP.
-
Make it yours — themes, settings, the embedded shell and browser access.
-
Show it — screenshots, captions and demo recordings as animated GIFs, scripted as a tape that you or an AI agent writes.
Getting Started
camel run my-route.yaml   # in one terminal
camel tui                 # in another: auto-discovers every running integration

camel tui .               # or open a project directory and press F10 to run it
No route yet? Press F2 and pick Run an example… to run one of the built-in examples on Camel Main, Spring Boot, Quarkus or JBang.
See Camel TUI Getting Started for each way to start, and for connecting existing Spring Boot and Quarkus applications.
| Press F1 or ? on any screen for context-sensitive help. Keyboard shortcuts are always shown in the footer bar. |
Tabs Overview
The TUI organizes information into tabs. Press number keys 1 through 0 to jump directly to any tab, or use Tab / Shift+Tab to cycle.
| Key | Tab | What It Shows |
|---|---|---|
1 | Overview | All running integrations and infrastructure services. Start here. |
2 | Source | File explorer and editor for your project code, with Camel checks, completion and documentation. |
3 | Log | Real-time application logs with search and filtering. |
4 | Activity | Live exchange activity with elapsed times, endpoint sends, and failure tracking. |
5 | Diagram | Visual route topology with drill-down into individual routes. |
6 | Routes | Route list with message counts, throughput, and processing times. |
7 | Endpoints | All registered endpoints with usage statistics. |
8 | Inspect | Message history and tracing — step through exchanges processor by processor. |
9 | Errors | Failures with stack traces and exchange context. |
0 | More | 30+ additional tabs organized by category (see below). |
The More menu (key 0) opens a popup with tabs organized into groups:
-
Routing — Browse Endpoints, Consumers, HTTP, Inflight, Producers, Route Controller
-
Observability — Circuit Breaker, Health, JFR, Metrics, Network Services, Exchange Events, Recovery Tasks, OpenTelemetry Spans
-
AI — Semantic (definitions, expert contracts, relationships and sample evaluation), Ollama (listed when an Ollama server is detected)
-
Data — JDBC DataSource, Kafka, Secrets, SQL Query, SQL Trace
-
JVM — Classpath, Heap Memory Histogram, Memory Usage, Memory Leak, Process, Startup, Threads
-
Project — Beans, Catalog, Configuration, CVE Audit, Maven Dependencies, Type Converters, Data Type Transformers
Tabs appear dynamically based on what the integration uses. For example, the Kafka tab appears when a Kafka component is in use, SQL tabs when a DataSource is present, Circuit Breaker when resilience4j is in use, Spans when OpenTelemetry is enabled, and JFR when camel-jfr is on the classpath. The TUI adapts to show only what’s relevant to your integration.
Tab badges show live counts — the Errors tab shows a red badge when errors exist and Routes shows the route count.
Two panels can be opened on top of any tab: F6 opens an embedded shell for running camel commands, and F8 opens the AI panel for asking questions about the running integrations. The panel is one of several ways to use AI with the TUI; see Ways to Use AI for how they compare.
More about the TUI
| Page | What it covers |
|---|---|
Your own routes, the built-in examples, opening a project, connecting Spring Boot and Quarkus applications | |
Reading and writing routes: checks as you type, quick fixes, fix with AI, completion, quick documentation, navigation, live run data | |
The architecture, topology and route views, external endpoints, metrics | |
Activity, message history, errors, spans, process, HTTP probe, CVE audit, Kafka, SQL, memory leaks, JFR, catalog | |
The AI panel, a coding agent over ACP, your agent over MCP, and | |
AI providers, slash commands, project overview, AI log | |
Ollama and OpenAI-compatible servers, the tool set for local models, what a question costs, the Ollama tab | |
MCP and ACP: what an AI agent can see and do, edits you confirm | |
The actions menu, embedded shell, themes, settings, browser access | |
Screenshots, presenting, recording a demo from a tape and converting it to a GIF |
Keyboard Shortcuts
Global (All Tabs)
| Key | Action |
|---|---|
1 - 0 | Jump to tab by number |
Tab / Shift+Tab | Next / previous tab |
F1 / ? | Context-sensitive help (toggle) |
F2 | Actions menu |
F3 | Switch between integrations (when multiple running) |
Ctrl+F | Browse the selected integration’s source files (the Overview tab also has plain f) |
F6 / Shift+F6 | Toggle the embedded shell panel / cycle its height |
F8 / Shift+F8 | Toggle the AI prompt panel / cycle its height |
F10 | Run menu (run, stop, restart, kill) |
Shift+F5 | Take screenshot |
Ctrl+C / Q / F2 → Quit | Quit |
Esc | Close popup / go back / return to Overview |
Source Tab
See the keyboard shortcuts of the Source Editor.
Command Line Options
| Option | Description | Default |
|---|---|---|
| Name, PID, or directory path of a Camel integration. When a directory is given, the TUI opens it as a project in the Source tab — you can browse the source code and run it with F10. When omitted, the TUI auto-discovers running integrations. | |
| Enable the embedded MCP server for AI agent access to the TUI. |
|
| Port for the embedded MCP server. |
|
| Enable the browser-accessible terminal (WebSocket) server. |
|
| Port for the web terminal server. |
|
| Screen refresh interval in milliseconds. |
|
| Color theme for this session (e.g., | |
| Play a | |
| Size of the recorded terminal for |
|
| Frames per second captured by |
|
| Maximum duration in milliseconds captured by |
|